A major takeaway from the survey of over 3,660 HNW collectors conducted by Arts Economics and UBS in 2024 was that they held an average of 15% of their overall portfolio of wealth in art – an important component of their personal assets. Their motivation was in part financial. The report noted that over 85% of the HNWIs surveyed felt that art was a relatively safe investment compared to traditional assets such as stocks, with a similar share agreeing it could be a useful portfolio diversifier. 24% of the high-net-worth respondents ranked financial considerations as a primary motivation for buying art – second only to the enjoyment (self-focus/pleasure) of the art itself. The survey was conducted in mid-2024 when most collectors were uncertain about the future of the art market, following a declining year for sales in 2023, and with weaker public auction sales being prominently highlighted in the art and financial press. A natural question therefore is where these beliefs about art as a safe and diversifying asset might have come from. Although many decisions that collectors make are guided by subjective drivers or advice from experts, there has been a growing body of more objective market knowledge over the last 30 years based on more quantifiable indicators, with much of the research about the risk and return of art as an investment coming from the study of art price indexes.
Price indexes track historical trends in art value. I have been constructing art indexes for most of my academic career, from centuries-long indexes of painting prices to creating an index of NFTs during the COVID-19 bubble. Over that time, art indexes have played an increasingly central role in the financialization of the art market. On the positive side, they have helped the collecting world and the financial world quantify the risk, return, and diversification potential of art as an asset class. But this process of measurement seems to have changed the way the world thinks about art.
I worry, with many others, that art has been transformed into capital by virtue of measuring its statistical characteristics. Responses by HNWIs in the 2024 survey belie that worry to some extent: 40% chose self-focused motivations as opposed to financial and social motives as their primary reason for collecting. Nevertheless – art is capital. And artists will tell you the same thing: The art they create is an economic product – the basis of their livelihood. Art has also been latent capital for passionate collectors who bought and treasured beautiful, curious, or precious things. Indeed, humans made, collected, and traded aesthetic objects before the modern human species emerged. Art played a role in politics and diplomacy even before money existed. Appraisers have opined on the value on art in estates since the Dutch Golden Age. But, as the saying goes, this time it’s different – driven in part by 20th century financial innovations.
A revolution in investment management began in 1952 with Nobel Laureate Harry Markowitz’s computer approach to portfolio optimization and emerged as a full-fledged equilibrium theory in 1964 with (another Laureate) William Sharpe’s Capital Asset Pricing model. Data, not analysts’ opinion, became the currency of modern portfolio theory. With good data, one could estimate the risk and return and correlation of stocks, bonds, and other assets, feed these into a portfolio model, and receive a recommendation on how much to invest in each asset.
University of Chicago’s Center for the Research in Security Prices (CRSP) quickly became the leading source for the essential data on stock and bond returns needed for modern investment management. But six years after CRSP’s founding, Sotheby’s chairman Peter Wilson launched the monthly Times-Sotheby’s Index, created by an Oxford-trained statistician Geraldine Norman (née Keen), who went on to publish several prominent quantitative studies of the art market. Academic studies of art as a portfolio asset followed quickly.
The first economist to use art auction prices to construct an index was Robert C. Anderson’s 1974 Paintings as an Investment. Other economists, including myself, have used and refined his repeat-sales technique. The growth of art auction databases and technologies around gathering large amounts of auction data online has now vastly improved statistical estimates of the risk and return of art as a broad category – with the essential metric being an index, or sub-indexes of art calculated from auction transaction prices. Investment advisors can now load these indexes, along with stock and bond indexes, into a portfolio optimization model and estimate the fraction to be invested in an art portfolio.
Tracking art alongside financial assets is a bit like comparing apples to oranges, however. There are important differences between art market indexes and financial market indexes. First, art is mostly heterogeneous – in short, most art is non-fungible – artworks are unique, and even identical prints can vary in quality, with one not as good as another. This makes the challenge of constructing an art index more like estimating a private equity or venture capital index, two widely popular alternative investments.
When there are no continuously observable market prices, it is hard to estimate crucial measures like diversification and risk – both of which rely on regularly recorded market prices of a standardized, fungible asset, like a share of publicly traded stock. That is just not how the art market works. Most art is sold through dealers who don’t register their sales prices in a common database. Auction houses do, however, and these have been the go-to sources for most academic research on the return, risk, and diversification potential for artworks. Although the results of these studies have varied, many have found that the average investment return on art over the long term is somewhere between that of stocks and bonds – but with higher volatility than stocks. Most agree that art has a modest to low correlation to other asset classes. These estimates also vary depending on the time period you study; like all assets, the art market has experienced sustained run-ups and declines.
Interestingly, while artworks only trade occasionally, art auction data for calculating auction indexes is actually better than the data for most other alternative investments. Thanks to a long history of auction price compilers and auction catalogs, a spotty but informative index can be constructed from the 18th century forward. Why is this of interest to investors now? In search of higher returns and portfolio diversification, the investment community is constantly in search of new asset classes. Over the past 30 years, investment managers have embraced private equity, venture capital, natural resources, hedge funds, private credit, cryptocurrency, non-fungible tokens, and other alternative asset classes. None of these have pricing data that stretch back centuries like the art market.
Investors chase promising opportunities. When some new asset class spikes in value, it is quickly touted as a high return, low correlation asset, appropriately illustrated by an index. Of course, indexes are indicative of past performance. Indeed, many newly created indexes are motivated by past performance: investments that have performed well will attract interest and a desire to see how they have done over the long term. A case in point: NFT indexes only appeared after prices took off in the COVID-19 era, two years after the 2017 launch of CryptoPunks. In short, indexes appear when investors are interested. But recent profitability can be a short-lived phenomenon. If the returns to some new category of collectible look too good to be true, maybe it is because indexes are more likely to appear at the top of a bubble, not at the end of a slump.
Another important but often overlooked consideration, as with all financial indexes, is that art indexes measure the performance of a large, diversified portfolio across all styles in the market, not a personal collection of a few hundred works. Holders of large collections should realize that the volatility of their portfolio is going to be substantially higher than the volatility of a broadly diversified art index.
Of course, there are more caveats. Auction price indexes don’t account for transaction costs. They don’t account for insurance, maintenance, and other expenses of holding the art. They do not capture the dealer trade in art. This is especially relevant given the fact that dealer sales and private sales accounted for a major fraction of the market in 2024, and the surveys of global HNWIs indicated in 2024 and in previous years’ research, that buying through dealers was their dominant preference for purchasing art and largest channel of expenditure. Indexes also exclude other channels for sales including artists’ direct sales and other agents selling artworks.
A subtle but important concern about non-fungible assets – a category that, in my view, includes paintings and real estate as well as NFTs – is that transaction-based indexes do not always represent the value that could be realized from buying and selling a work. A work will sell only when it exceeds the seller reserve, and therefore all works that are bought-in at auction are not included in an index. That means lower valuations – bids that fall below the reserve – are missing. If you only count what sold, and ignore what didn’t, your view of an asset class will be misleading. This problem is being explored by academic researchers, with adaptations to the techniques used to construct indices which adjust for this bias and correctly estimate an art index.
The 2020 NFT bubble is a perfect case in point. If you only used realized sales – and ignored the huge numbers of works on offer – you would have massively overestimated the value of your NFT. In recent work with my co-author Dong Huang, we applied these correction techniques to transactions in a major NFT marketplace. We found three interesting things. First, the corrected index was lower by more than an order of magnitude than the uncorrected index. Despite that, however, we found the NFT bubble was likely bigger than the famous Dutch Tulip Bubble. Second, the corrected index turned sharply down in 2021 and showed a catastrophic collapse in prices through July 2022 – even while a standard index showed prices wobbly but still high. This index timing delay can lead to mismeasurement of risk and diversification. Finally, we tested to see if astute investors – those who negotiated their bidding prices to find the seller’s true reserve – made money out of the bubble. Indeed, they did. Those who took the trouble to negotiate prices, rather than simply accepting the asking price set by the seller, ended up making a profit. Our evidence showed the importance of market experience and understanding market conditions. Successful NFT speculators tended to buy across a wide range of prices – indicative of the breadth of their market participation. We also believe this experience mitigated the reliance on general trends versus conditions specific to individual works – for example, how long it was listed or how likely the seller might be to discount the price.
I see some benefits of the financialization of art in bringing art to public attention. Stories of finding a masterpiece at a yard sale have almost certainly stimulated public interest in the history of art. High prices alone makes one wonder – and perhaps investigate – why the work of a particular artist is so desirable. Financially motivated buyers of high-value blue-chip paintings, who bought for investment but held for passion, may come to appreciate how art enriches lives. From an artist’s perspective, anything that increases the demand for art can’t be a bad thing. Nevertheless, tastes in art can shift, and unless you understand the nature and limitations of indexes constructed from auction sales, you might be negatively, or positively surprised.
I am a believer in statistical tools for valuation and in the use of indexes as a guide for investment management – even given all the caveats above. Much progress has been made in the development of methods for integrating art and other non-fungible assets into the portfolio construction process.
Art is a particularly interesting domain of economic research because its primary value is non-pecuniary: society places a high monetary value on the aesthetic experience it renders. In on-going work with my co-author Amy Whitaker of NYU, we use US estate tax data to estimate an aggregate value for art in the US in 2020 between $1.5 and $2 trillion – 75% of which was held by HNWIs. Counting other passion assets, Christophe Spaenjers, Stijn Van Nieuwerburgh, and I estimated that collectibles represented more than 5% of personal US wealth in 2020.6 Properly constructed and understood, indexes can tell us a lot about art’s role in an investment portfolio. Aggregate measures of value – as well as the responses to questionnaires from art collectors – confirm humankind’s commitment to creativity.
William Goetzmann is the Edwin J. Beinecke Professor of Finance and Management Studies, the faculty director of the International Center for Finance, and director of the SOM Executive MBA in Asset Management at the Yale School of Management.
The original version of this text includes footnotes. To view cited sources, please download the full report here.
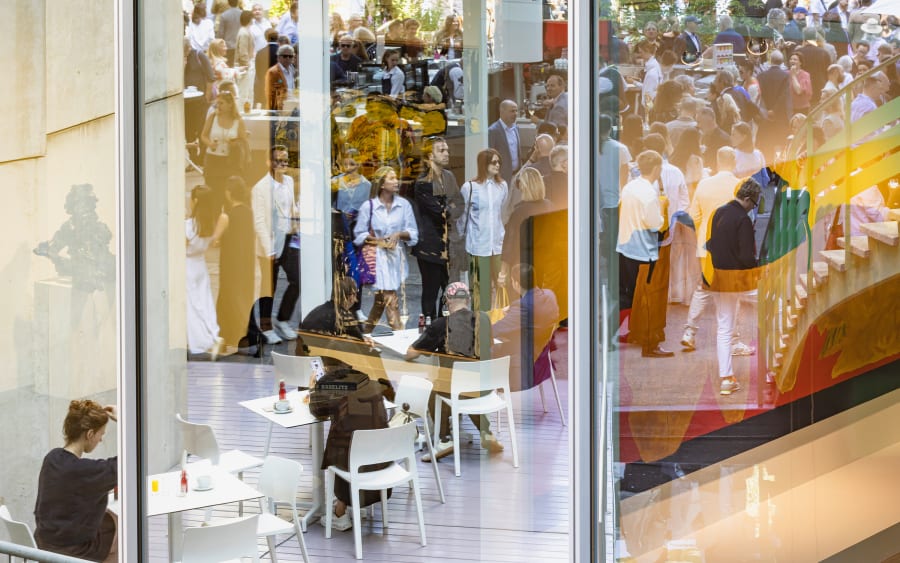
Caption for top image: Xie Lei's work, presented by Sies + Höke at Art Basel 2025.
Published on July 17, 2025.


